Sessions | Dialogues

15:45 - 16:30⋅ Hall

Bangalore International Centre

AMA: So You Want to Work with Data.

Data visualization has no single entry point. People arrive from journalism, design, engineering, social science, and places that have otherwise little to do with charts. If you're trying to figure out how to actually get into this field, what to learn, what kind of work exists, whether it pays — this is for you. A panel discussion with three practitioners who talk honestly about the work, the career, and how they found their way in.

Anushka Gokhale

Lead Designer · EPIC World

Sandeep Karmarkar

Head of Design · Atlassian

Hamsa Ganesh

Founder · Thoughtput

Areena Arora

Editorial Coder · The Hindu
About this session

Data visualization sits at an uncomfortable intersection; part design, part journalism, part engineering, part storytelling. Nobody arrives fully prepared and everyone spends at least some time feeling like an imposter. If you're early in your journey and wondering whether a career in data viz is for you — and where you'd even begin — this session is for you.

What do you actually need to know before you touch a tool? What does a typical workday or a real project look like? What are the career structures that exist in this field in India, and what does compensation actually look like across them? Three practitioners — Sandeep Karmarkar, Hamsa Ganesh, and Areena Arora — with varying experiences, will address these questions from three different vantage points. Between them, they represent the corporate design track, the independent studio track, and the newsroom track. The conversation will be structured, yet informal.

No one usually has it all charted out. No maps for a career in this field. But by the end of the session, you'll leave with a clearer picture of where you might fit, a more honest sense of what the work actually demands, and at least one answer to a question you've been carrying around for a while. Where your path goes from here is still yours to figure out. But you'll have a better sense of the terrain.

About the speakers

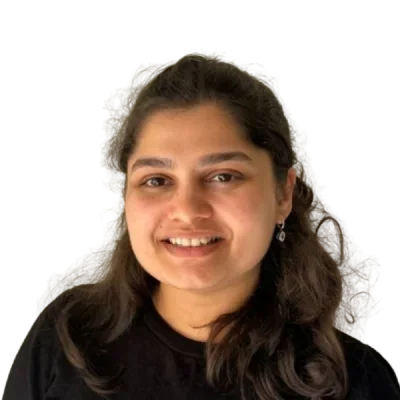
Anushka Gokhale

Anushka Gokhale

Anushka Gokhale is a Product Designer and number-crunching storyteller. In her 5+ years of experience, she has collaborated with mission-driven teams and designed data-heavy products across govtech, conservation tech, fintech, and spatial intelligence — bridging the gap between data and people.

Currently Lead Designer at EPIC World. Previously Senior Product Designer at Parallel HQ and CivicDataLab, and Visiting Faculty at SMI.

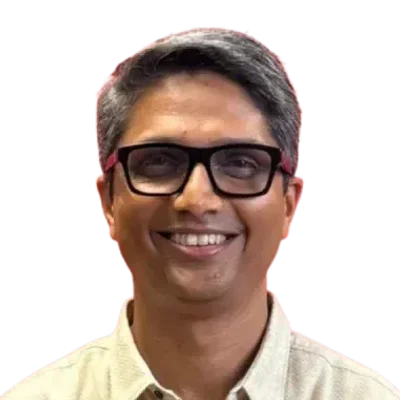
Sandeep Karmarkar

Sandeep Karmarkar

Sandeep Karmarkar is a design leader with over two decades of experience spanning visual design, UX, product strategy, and team leadership across global technology companies. He currently serves as the Head of Design for the IT Operations portfolio at Atlassian, where he leads teams focused on building effective experiences for managing complex systems at scale. He has previously held leadership roles at Uber, Google, and Nutanix.

Over the years, he has worked on products used by millions across mobility, cloud platforms, security, and public transport experiences in India. Deeply passionate about data visualization and information design, Sandeep has actively hired, mentored, and supported many young designers from Information Design backgrounds throughout his career. He is equally passionate about building high-performing teams and bridging industry with education through talks, workshops, mentorship, and teaching engagements.

A marathon runner, trekker, and digital artist, he brings the same curiosity and endurance from the mountains into the world of design leadership, innovation, and storytelling.

Hamsa Ganesh

Hamsa Ganesh

Hamsa is a designer and independent web practitioner interested in how institutions organise, preserve, and communicate knowledge online.

Areena Arora

Areena Arora

Areena Arora is a journalist who transforms messy data into stories that matter. She uncovers patterns hidden in datasets, then designs how people encounter and understand those stories.

Her work sits at the intersection of rigorous reporting and intentional design. She asks: What is the data trying to tell us? How do we present it such that people actually listen and grasp its intricacies? Before finding her way to this unique blend as The Hindu's first-ever Editorial Coder, she reported on public education and local governance in Tennessee, U.S.

She's obsessed with making complexity accessible. When she's not chasing stories in data, she's cooking up a storm, always up for feeding an army.

VizChitra WhatsApp linkVizChitra instagram linkVizChitra twitter linkVizChitra linkedin linkVizChitra bluesky linkVizChitra youtube linkVizChitra github link

Copyright © 2026 VizChitra. All rights reserved.